By their adjacent positions on the Business Model Canvas, relationships among your Value Propositions, Key Resources, and Key Activities are implied:

Stock-flow visualizations help make the causal relationships among Key Activities and Key Resources explicit.
Stock-Flow Maps as Visual Representations
Consider a retailer of specialty audio products that plans to differentiate itself by offering exceptional, personal customer service. To increase its customer service capacity over time, the business must increase the number of trained customer service representatives (“CSRs”). The number of CSRs is a Key Resource or stock (shown as a rectangle below):
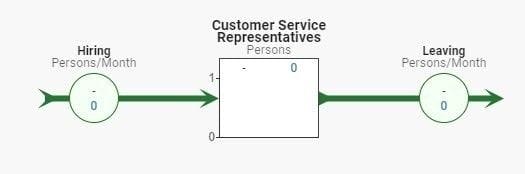
- Hiring represents an inflow to the CSR stock.
- Leaving represents an outflow to the CSR stock.
The level of the CSR stock over time is entirely determined by the Hiring inflow relative to the Leaving outflow. To increase the stock, you must either increase the Hiring rate, slow the Leaving rate, or both.
Let’s assume that the Hiring rate is constrained by the company’s training capacity of three (3) employees per year. Furthermore, a CSR stays on the job for 18 months before changing roles or leaving the company’s employment. Training Capacity and Retention Duration are variables.

Furthermore, let’s assume that the average cost incurred to hire and train a new CSR is $5,000. We can see that it makes sense to expand our model to include another resource—the Available Recruiting Budget.
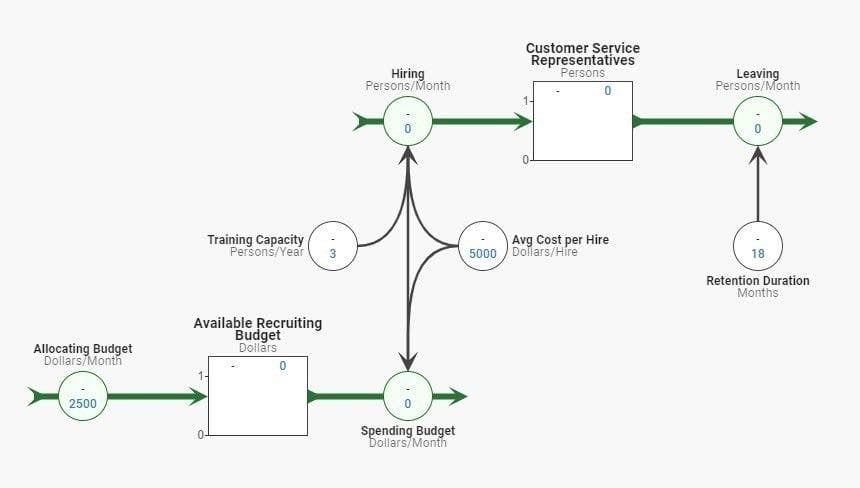
Even a simple stock-flow model like this one, which can be drawn on a napkin, can help clarify our thinking about Key Activities. In this case, we’ve identified a menu of possible actions. In order to increase her business’s stock of CSRs, she might:
- Increase the amount of budget allocated to recruiting CSRs
- Seek ways to reduce the average cost per hire
- Explore methods to reduce the average cost of hiring and training a new CSR
- Pay more attention to retaining existing CSRs
We find that stock-flow visualizations accelerate our thinking about business dynamics. Maybe more importantly, they help us share our logic regarding cause and effect with others.
Using Business Simulations
Hand-drawn stock-flow maps can be quite useful. They can often be made even more useful by using special software (Silico in this example) to add numbers and mathematical relationships to create a business simulation.
To continue the example of the seller of audio products, she would expect to hit a ceiling of about four (4) CSRs under the illustrated set of assumptions.
The software allows us to explore how changes to the Training Capacity, Retention Duration, and Allocating Budget rate might influence the steady-state level of the CSR stock:
Simulations are helpful in a variety of ways:
- They can help you explore a range of possible futures quickly and cheaply. It’s time-consuming, expensive, and risky to run experiments in real-time through your real-world business!
- By making your assumptions about your business explicit and by quantifying them, you make them testable. If reality diverges from your model, you have a chance to adapt quickly.
- Playing around with little, throw-away models can refine your intuition and help you develop more useful rules-of-thumb.
Key Ideas
- Stock-flow maps allow you to specify the relationships between Key Resources and Key Activities. By doing so, they help clarify the sequence and priority of your actions.
- Even a hand-drawn stock-flow map can help you explain your understanding of cause-and-effect with others.
- By using software such as Silico, you can convert your stock-flow map into a simulating model that can allow you to explore possible futures, interactions among variables, and trade-offs.